Lupovis Intelligence Research
Report · May 2026 · TLP:CLEAR

The internet changes shape
before the advisory.

A 120-day study of pre-disclosure scanning activity across exposed enterprise paths. Sensor-driven, statistically validated, and published with full methodology. Read the report and push back on the analysis.

Register to read the report
Access the report

Register to read the full report.

The Internet Changes Shape Before the Advisory — 120 days of sensor telemetry, three case studies, and the permutation test that validates the lead-time finding at p = 0.001. Register below and the report link is delivered to you immediately after.

Case study · Fortinet

Three scanning surges in five days. One CVE. Lead times compressed 7d → 4d → 2d as disclosure approached.

Fortinet scanning surge timeline showing three events at decreasing lead times before CVE-2026-39808 disclosure on 14 April

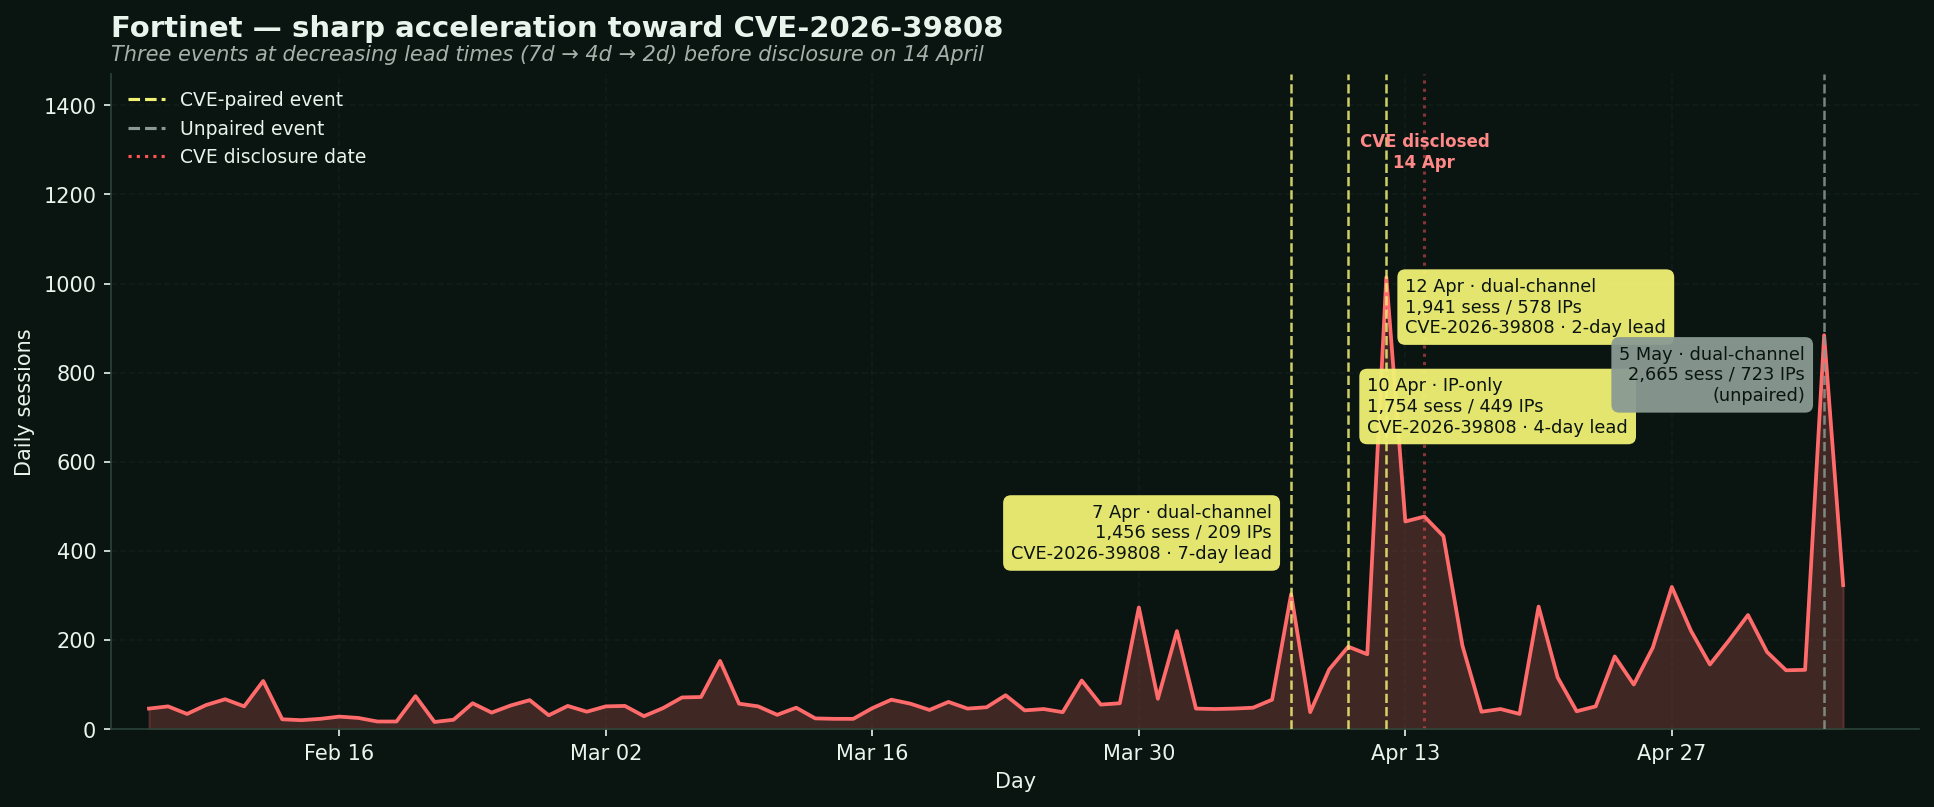
Daily session activity on Lupovis sensors against exposed Fortinet paths, with three dual-channel events on 7, 10, and 12 April all paired to CVE-2026-39808 (disclosed 14 April). Lead times: 7 days, then 4 days, then 2 days. Activity ramped, then the CVE published.

Findings · n=31 paired events

What 120 days of sensor telemetry actually showed.

01

Vendor-aligned scanning surges cluster in the final week before CVE disclosure.

Of 31 spike events that paired with a public CVE in the analysis window, 19 had a spike start 1–7 days before the disclosure date. A 1,000-iteration random-date permutation test confirmed this concentration is unlikely to be chance: under the null model, the count of actionable pairings never exceeded 13 across 1,000 permutations, against an observed value of 19.

19 of 31 · 61.3% · p = 0.001 by count
02

The Fortinet ramp shows lead times compressing as disclosure approached.

Three separate scanning surges between 7 and 12 April — all paired to CVE-2026-39808 — showed lead times of 7 days, 4 days, and 2 days. Activity intensified as the disclosure date neared. This kind of compressing-lead pattern is hidden by averages and is, in operational terms, the closest thing to a textbook ramp signature in the dataset.

3 events · 5 days · 1 CVE · 7d → 4d → 2d
03

Eleven ASNs touched 9 or more distinct path families across the window.

Cross-surface infrastructure participation is concentrated in a small, namable tier. The most concentrated signal comes from small providers, not large clouds: Tamatiya EOOD reached 9 path families with only 18 unique IPs (paths-per-IP ≈ 0.50) — an order of magnitude more concentrated than DigitalOcean (11 paths, 806 IPs). Tracking ASNs that touch many surfaces is more durable than tracking individual IPs that rotate quickly.

11 ASNs · 0.9% of population · upper 3.8% threshold at 8 paths
04

Different surfaces produce different attacker behaviour shapes.

Fortinet showed sharp acceleration toward a specific CVE. Ivanti showed sustained pressure across multiple days, including a large unpaired event. Git showed broad multi-day discovery against developer infrastructure. Dual-channel events — where session volume and unique-IP breadth move together — accounted for 27 of 55 clustered events and almost all the high-volume activity.

27 of 55 dual-channel · three case studies in the report
Methodology

We tested whether the lead-time pattern is real. Here's the null model.

The analysis pairs vendor-specific spike events against CVE disclosures within a 21-day forward-looking window using vendor-string matching. To validate the headline finding we ran a 1,000-iteration random-date permutation test.

The null preserves all 31 spike start dates, all per-vendor CVE counts, and the 21-day pairing window. It randomises only the disclosure dates of CVEs across the observation window. For each permutation we re-pair the spikes using the same nearest-forward algorithm and count how many pairings fall in the 1–7 day window.

Both the count test (more direct) and the rate test (more conservative) reject the null at the 5% level. The full report contains the analysis pipeline, alias table, and limitations.

Permutation test · 1,000 iterations
Observed actionable count 19
Null mean count 5.4
Null 95th percentile count 9
Null max count (1,000 perms) 13
p-value by count 0.001
p-value by rate 0.021
Framing

What this is. What it isn't.

What it is

A triage signal for exposure review.

Vendor-aligned path anomalies on Lupovis sensors concentrate in the days before related public CVE disclosures more often than chance produces. When activity around a vendor's exposed paths starts moving, defenders have reason to validate exposure ahead of the advisory cycle.

What it isn't

A CVE prediction engine.

We do not know which CVE is coming. We know the activity around a vendor's exposed paths often shifts first. The report does not establish causality, and not every disclosure in the dataset is preceded by a detectable spike. The 31 paired events are a lower bound on lead-time evidence.

About Lupovis Intelligence

Lupovis Intelligence is the research arm of Lupovis, publishing original analysis from a global network of sensors.

Our work supports preemptive security — the discipline of acting on attacker behaviour before it reaches your perimeter. Deception and contextual intelligence are operational expressions of that discipline; sensor-driven research is how we test what works.

We publish methodology in detail. We document limitations. We make findings reproducible from the data we describe. The point of doing this in public is to have the conversation in public.

About the broader platform

Lupovis is building infrastructure for preemptive security across deception and contextual intelligence. Research published here informs the platform; the platform supports the research.

Visit lupovis.io →

Discuss the methodology.

Pushback on the null specification, alternative pairing algorithms, or your own use case — direct human contact preferred over forms.